A dashboard showing teacher recruitment and retention challenges in each English local authority area has been created by the National Foundation for Educational Research (NFER).
It comes as the school staffing crisis looks set to deepen. Last week, figures showed the government had missed its target for recruitment of new secondary school teachers by 41 per cent this year, while fewer primary teachers were recruited than needed.
Among the other new insights offered by NFER’s dashboard, which was funded by the Nuffield Foundation charitable trust, is the acute issues faced in schools with a higher than average proportion of children receiving free school meals (FSM).
NFER used government data including the school workforce census and provider-level initial teacher training (ITT) statistics to create the tool.
School workforce lead Jack Worth said it would “support local and national decision-makers to take action to address teacher shortages in areas struggling the most”.
Dr Emily Tanner, education programme head at the Nuffield Foundation, said the dashboard “provides key insights into the teacher workforce, showing how the quality of education that students receive varies according to where they live and the type of school they attend.”
Here is a round-up of five key findings.
1. Teachers more likely to leave high-FSM schools
Data used by NFER for its dashboard spans a period of five years, from 2015 to 2020.
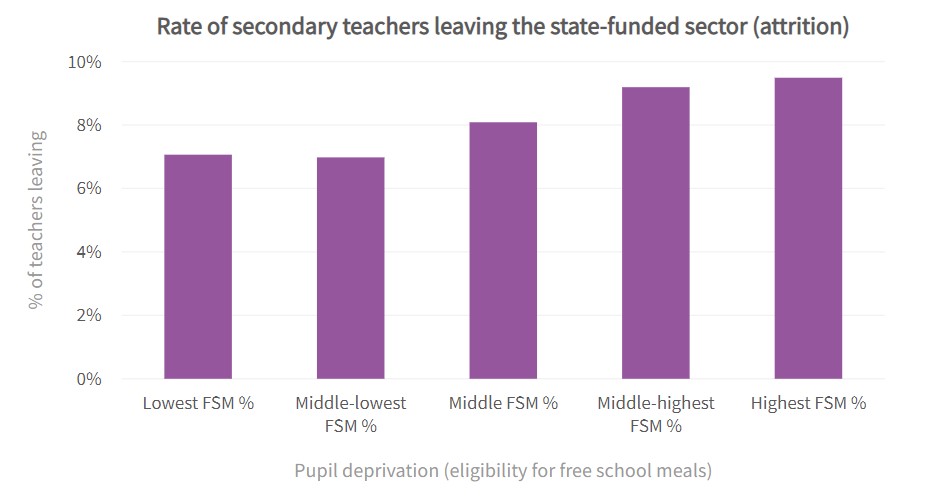
It shows that in 2020, the rate of secondary teachers leaving the state-funded sector was higher at schools with larger proportions of pupils on free school meals.
The schools with the highest proportion of FSM pupils saw an attrition rate of 9.5 per cent in 2020. This is compared to 9.2 per cent in schools with the middle-highest FSM, 8.1 per cent of those with the middle proportion of FSM and 7.1 per cent in schools with the lowest.

Teacher departure rates were calculated on the basis of teachers absent from the school workforce census that were present in the previous census, presented as a proportion of the number of full-time teachers in the previous census.
2. Poorer-intake schools struggle to get science teachers
Data on the proportion of science hours taught by teachers without a relevant undergraduate degree in 2020 is not included in the dashboard.
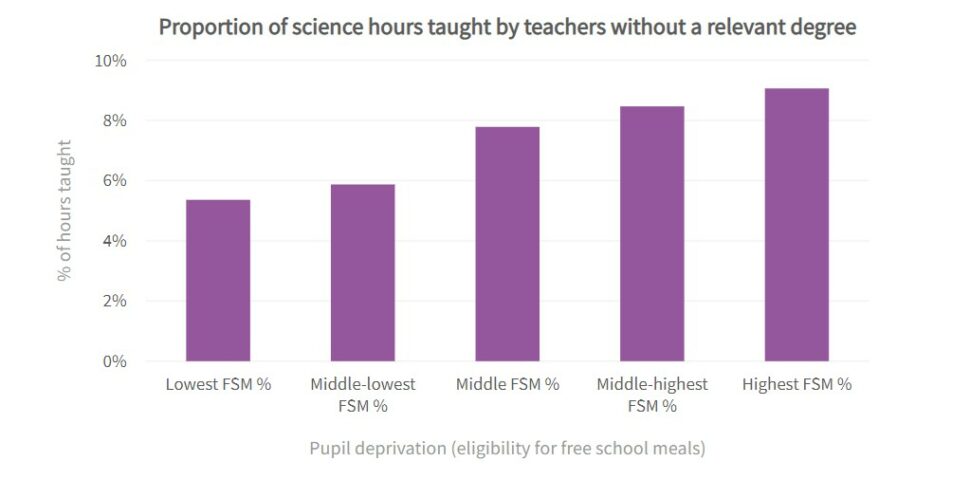
But figures for 2016 to 2019 show a strong correlation between levels of pupil deprivation and the amount of science classes being taught by a non-expert.
In 2019, 9.1 per cent of science hours were taught by teachers without a relevant degree in schools with the highest proportion of FSM. This is compared to 7.8 per cent in schools categorised as having the middle proportion of FSM, and 5.4 per cent with the lowest.

3. Areas lose up to a third of their secondary teachers
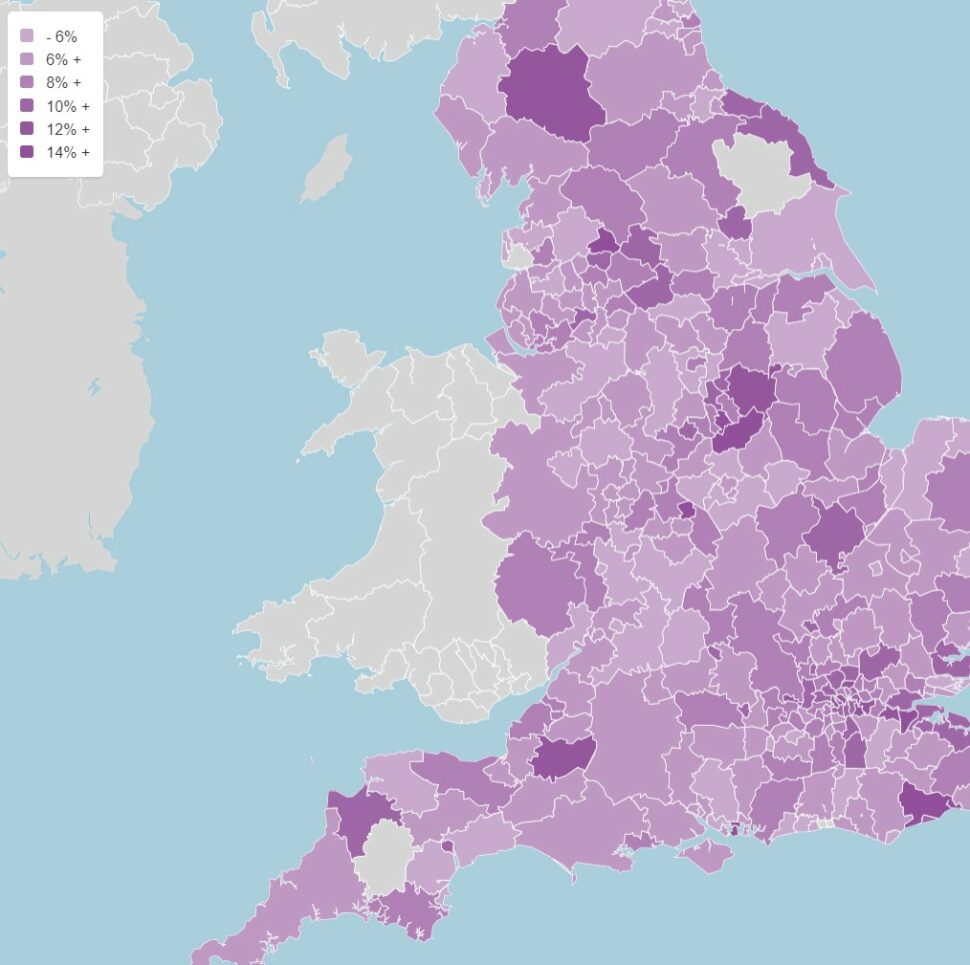
The dashboard shows huge discrepancies in the attrition rate of working-age secondary teachers leaving the state-funded sector across local authority areas.
In 2020, secondary teachers left schools in Nottingham at a rate of 33 per cent. This is the equivalent of three in 10 secondary teachers.

The rates for Pendle in Lancashire and Rother in East Sussex were also high – at 24.6 per cent and 19.3 per cent respectively.
The median rate across local authority areas was 7.6 per cent, but in West Lindsey in Lincolnshire, the rate was only 2.7 per cent.
However, teacher departure patterns are likely to have changed in the aftermath of uncertainty caused by the Covid pandemic.
4. New language and computing teachers most likely to leave
Subjects in which the Department for Education (DfE) has particularly struggled with ITT recruitment are also among those which see the highest leaving rate.
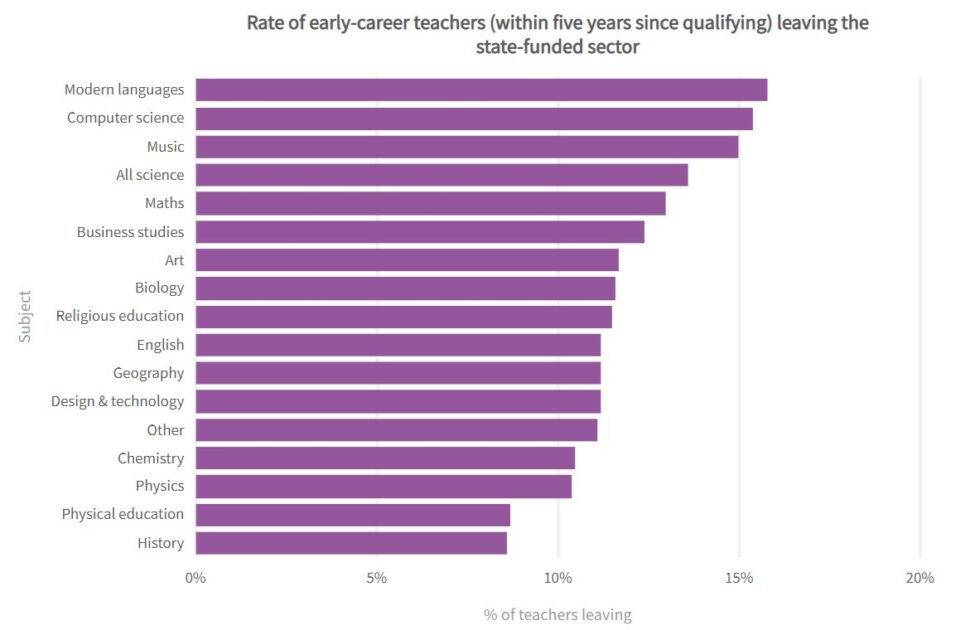
In 2020, modern languages saw the highest rate of teachers leaving the state-funded sector within five years of qualifying – at 15.8 per cent.
Computer science had the second highest rate, at 15.4 per cent, while collectively, science subjects saw a rate of 13.6 per cent.
In 2022, the government met only 17 per cent of its recruitment target for trainee physics teachers, and 30 per cent and 34 per cent of its target for languages modern languages and computing teachers respectively.

5. Areas spend £200+ per pupil on supply teachers
In 2020, the median average that schools in England spent on supply teachers per pupil was £74.40, data from the dashboard shows.
However, schools in 79 local authorities spent an average of £100 or more per pupil on local authorities, while schools in six local authorities spent £200 or more on average.
The discrepancy does not appear to show a distinct north-south divide, nor one between rural and urban areas.
Schools in South Holland in Lincolnshire spent the most per pupil, at £269.70. Burnley in Lancashire spent an average of £239.
Newham in east London, Westminster in central London, Watford in Hertfordshire and Bury in Greater Manchester also all saw schools spend on average more than £200 per pupil on supply teachers.


What about Primary School data and the fact that ECTs recently obtaining QTS cannot find jobs as schools appear not to wanr to bother mentoring them due to time the mentors need to have out of class that needs to be covered ? No wonder there are shortages.
[…] shot down are all we’re interested in, experts in the system will get frustrated and leave in droves, and we start to struggle with strategies for both armament and the wider climate2. What I’m […]